August 12, 2021
By Luke Powell, WELL AP, LEED AP
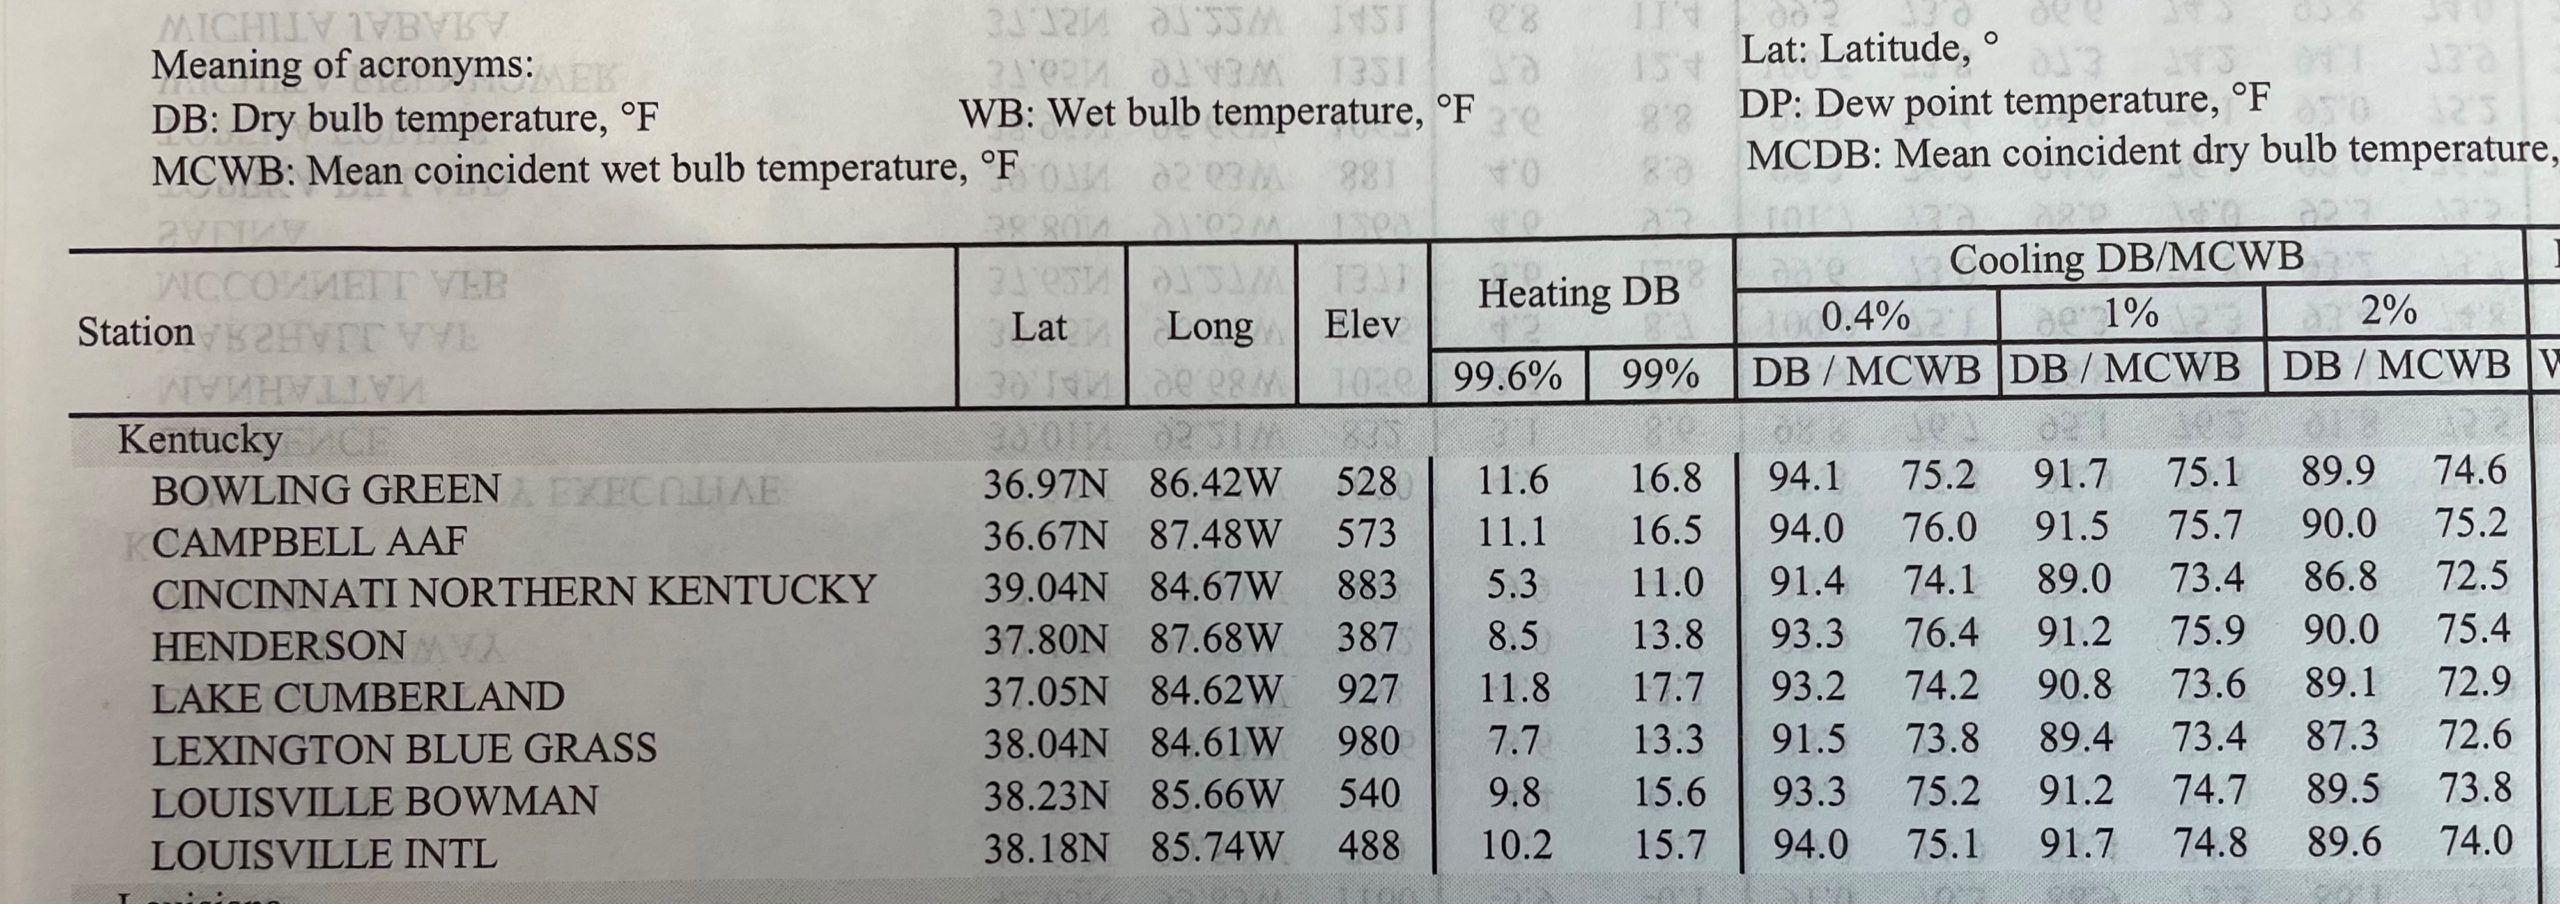
As I type this, the ambient (outdoor) temperatures are 95°F dry bulb and 79°F wet bulb here in Louisville, KY. Those conditions are above a “design day” for Louisville (94.0°/75.1°).
The American Society of Heating, Refrigeration and Air Conditioning Engineers (ASHRAE) puts out updated design-day or what they call Climatic Design Conditions every four years in the Fundamentals Handbook. Design-day is the term used more frequently in HVAC discussions.
Design-day is used to describe a period of time with maximum conditions that a HVAC system was designed to accommodate and maintain the desired indoor temperature and humidity.
The 2021 update in the Fundamentals Handbook includes climate data from more than 1,100 more climate stations than the 2017 version.
The climate data chart is always updated with recent, reliable climate data to help building professionals size and design building components. The Handbook chapter also contributes to ANSI/ASHRAE Standard 169, Climatic Data for Building Design Standards. The climatic data is processed and published based on the average conditions over the past 25 years. However, in many locations, ASHRAE has recorded rapid changes. Where these changes are deemed statistically significant, they now report the decadal trends for some of the key design elements.
Warm season and humidity conditions are based on annual percentiles of 0.4 or 1.0% while cold season conditions are based on annual percentiles of 99.6 or 99%.
The design temperature is the extreme hot or cold temperature that includes everything up to or below a certain percentage of hours in the year. So, a 1% design cooling temperature will be higher than a 2%, but lower than a 0.4%.
The 0.4% Summer Design Dry Bulb and coincident Wet Bulb Temps mean that the summer temperatures in a year for that location will exceed this design value only about 0.4% of the time. This often represents conditions on hot, mostly sunny days.
Therefore, every year, statistically speaking, there will be 35 hours (8,760 hours in a year) where the outdoor design conditions are exceeded. These are the periods of time where your HVAC system is not designed to be able to adequately cool, dehumidify or heat your space.
If an HVAC system were sized such that it could maintain an indoor temperature of 72 degrees on days that the outside high is 94°F dry bulb, this doesn’t mean that you will necessarily be hot inside all day if the dry bulb outside peaks above 94°F.
Even if the daily air temperature highs are a few degrees above the average daily temperature, the cooling system will have other hours of the day and night to catch up and cool the space. Not to mention that the thermal mass of the building and its contents limit the temperature overshoots for those few hours per day that it overshoots 94°F outside.
The relationship of cooling load to outdoor air temperature isn’t nearly as strong with determining cooling loads as it is with heating loads. Not to mention the effect that construction of the building will have on how well the HVAC system can keep up under extreme conditions. Of course, HVAC equipment designers and contractors rarely have control over the building envelope and usually don’t know how much infiltration a building will have. If the application is so critical in nature that even a few hours above or below required indoor space temperatures or humidity levels cannot be risked, then ambient conditions above even 0.4% for summer and 99.6% for winter should be considered.
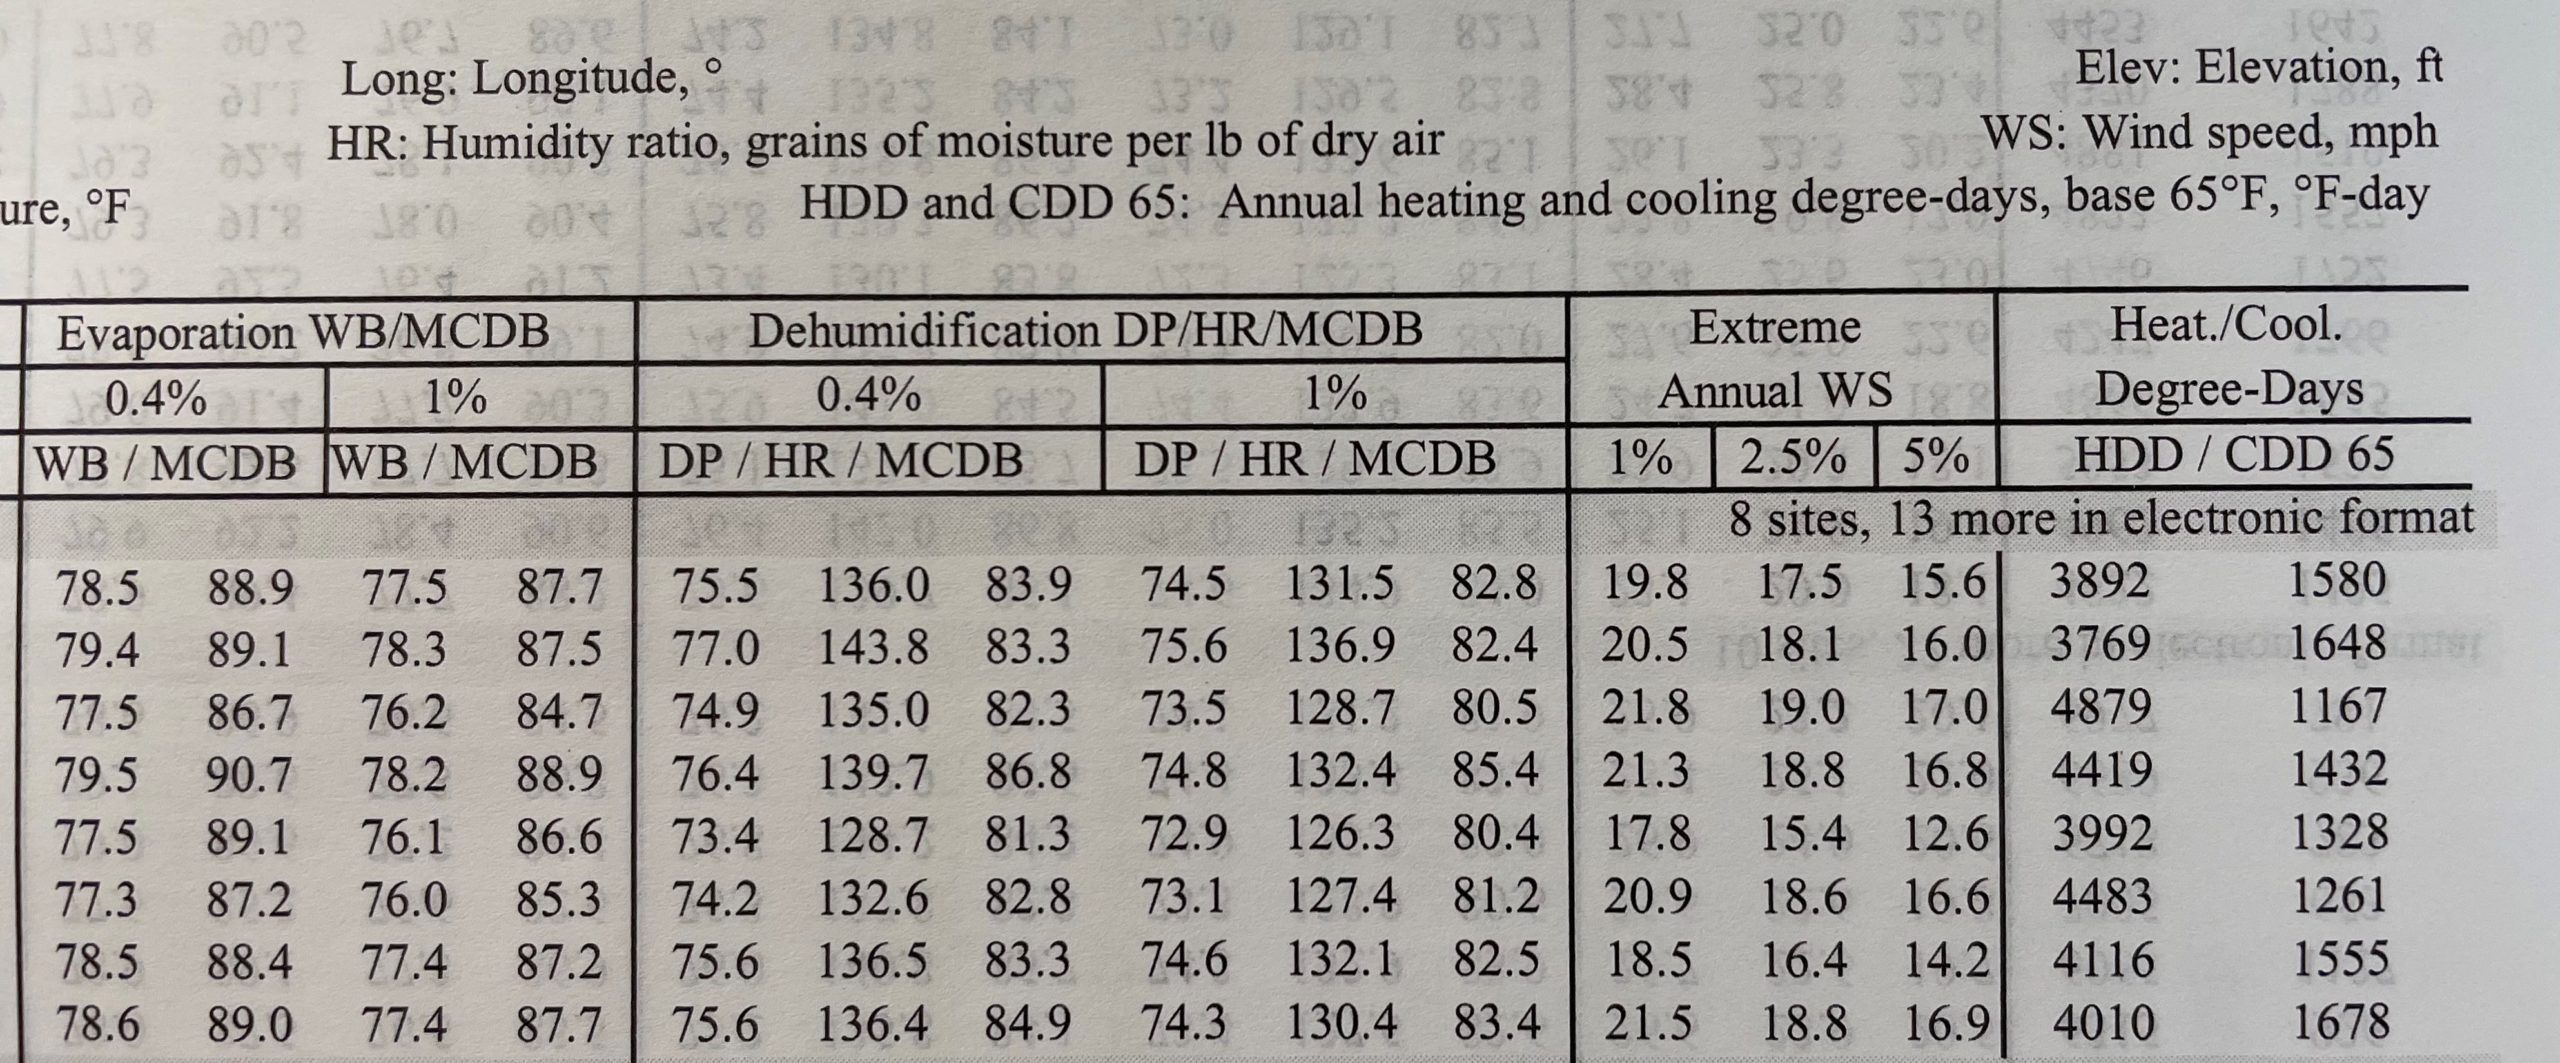
Design conditions based on Dew Point temperatures are directly related to extremes of humidity ratio, which represent peak moisture loads from the weather. Extreme dew-point conditions may occur on days with moderate dry-bulb temperatures, resulting in high relative humidity. These values should be used for applications where humidity control is critical. Theses values should be used as a check point when analyzing the behavior and capabilities of the HVAC system at part-load conditions, particularly when the systems are used for humidity control as a secondary function after dry bulb temperature control.
It is worth noting that the climatic design conditions have changed over the years. When comparing conditions for 1274 sites between the period 1977-1986 and 1997-2006, the results are as follows:
- The 0.4% annual dry-bulb temperature increased 1.42°F
- Annual dew-point increased 0.99°F
Just for fun, I looked up some of the extremes:
- Highest 0.4% dry bulb cooling design temp in the US: Desert Resorts, CA @ 112.6°F
- Lowest 0.4% dry bulb cooling design temp in the US: Anchorage, AK @72.5°F / Buzzards Bay, MA @ 76.5°F
- Highest 0.4% wet bulb cooling design temp in the US: Mellington-Memphis, TN @ 80.8°F
- Highest 0.4% humidity ratio for dehumidification temp in the US: Venice Pier, FL @ 164.0
- Lowest 99.6% dry bulb heating design temp in the US: Fairbanks, AK @ -42.2°F / Duluth, MN @ -17.3°F
- Highest 99.6% dry bulb heating design temp in the US: Miami, FL @ 49.0°F
DEFINITIONS:
Dry Bulb Temperature: The temperature of the Air under normal circumstances measured with the help of thermometer.
Wet Bulb Temperature: This temperature can be measured by using a thermometer with the bulb wrapped in wet cloth. The adiabatic evaporation of water from the thermometer bulb and the cooling effect is indicated by a “wet bulb temperature” lower than the “dry bulb temperature” in the air. If the air is humid then rate of evaporation would be less and cooling effect will also be reduced. In such situation the difference between Dry Bulb and Wet Bulb temperature will also reduce.
Dew Point Temperature: The temperature where water vapor starts to condense out of the air (the temperature at which air becomes completely saturated). If the air is highly humid then in such case Dew Point would be close to Dry Bulb temperature.
Humidity Ratio: How much ‘air’ is in the air versus the amount of water. Measured in units of pound-mass of water per pound-mass of dry air. By multiplying by 7000 [grains per pound-mass], this value may be expressed in grains of water per pound-mass of dry air. Relative Humidity on the other hand, takes the humidity ratio, and includes the air temperature, and the maximum amount of water the air can hold, and displays it as a percentage